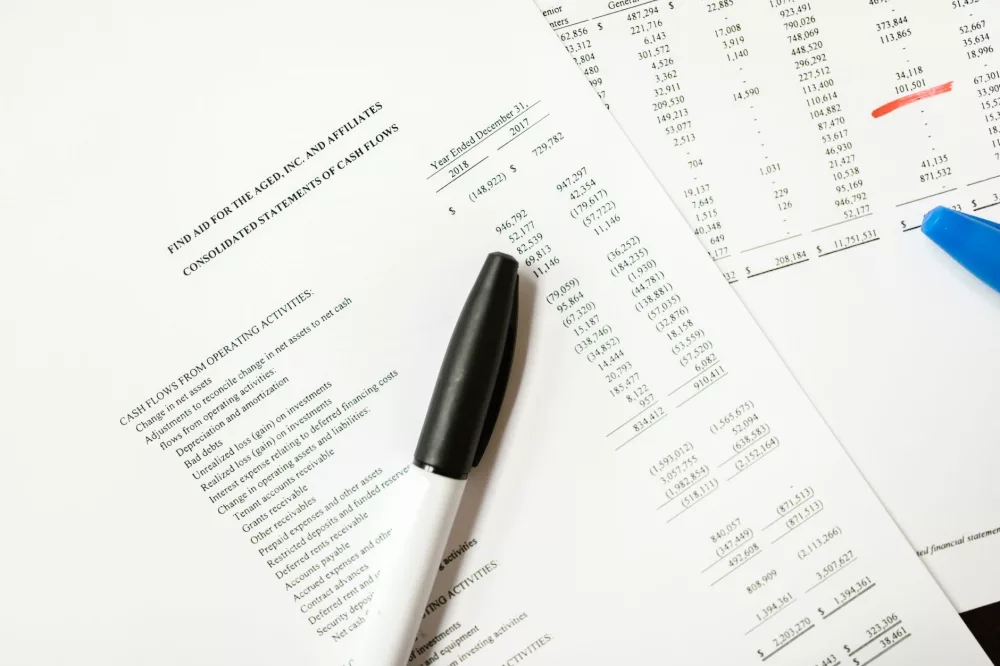
When you're sifting through financial statements, trying to make sense of a company's performance, you'll encounter a ton of acronyms. It's like a whole new language, right? One of the most significant, and frankly, one I pay a lot of attention to, is PAT. So, what's the PAT full form in finance? It stands for Profit After Tax. It might sound simple, but let me tell you, it's a super critical indicator that tells you a lot about a company's true profitability and its ability to generate wealth for its shareholders. We're going to break down exactly what PAT means, why it matters so much, and how to interpret it effectively.
What Exactly is Profit After Tax (PAT)?
Okay, let's get down to basics. Profit After Tax, or PAT, is precisely what its name implies: the amount of profit a company has left after all its operating expenses, interest payments, and, crucially, taxes have been deducted from its revenue. Think of it as the ultimate bottom line on an income statement. It's the money that's truly available for distribution to shareholders as dividends or for reinvestment back into the business for future growth. If you ask me, this figure is the clearest representation of a company's net earnings.
How Do We Calculate PAT?
Calculating PAT isn't rocket science, but it does require you to follow a specific sequence. We start with the company's revenue and progressively subtract various costs until we arrive at our desired figure. Here's a simplified breakdown of the general flow:
Revenue
- Cost of Goods Sold (COGS)
= Gross Profit
- Operating Expenses (like salaries, rent, marketing)
= Earnings Before Interest and Taxes (EBIT)
- Interest Expense
= Profit Before Tax (PBT)
- Taxes
= Profit After Tax (PAT)
So, you see, it’s a journey from the top line all the way to the very bottom. Each step whittles down the initial revenue, accounting for different types of costs the business incurs. When I look at this, I consider the tax deduction as the final hurdle a company has to clear before it can truly claim its earnings.
- Revenue: This is the total money a company brings in from selling its goods or services. It's where everything starts.
- Cost of Goods Sold (COGS): The direct costs attributed to the production of goods or services sold by a company.
- Operating Expenses: These are the costs associated with running the business, not directly tied to production. Think administrative costs, selling expenses, and general overhead.
- Interest Expense: The cost a company pays for borrowing money. This is an important one because it shows how debt affects profitability.
- Taxes: Income tax liabilities that a company must pay to the government based on its taxable income. This is the crucial last step before reaching PAT.
Why is PAT Such an Important Financial Metric?
Honestly, PAT is a cornerstone of financial analysis for several compelling reasons. It isn't just a number; it's a story about a company's efficiency and ultimate success. Investors, creditors, and management all rely heavily on it.
Key Derived Metrics and Their Significance
For me, PAT isn't just interesting on its own; it's also the basis for other really insightful financial ratios:
- Earnings Per Share (EPS): This is probably one of the most watched metrics by investors. It tells us how much profit a company makes for each outstanding share of its stock. You calculate it by dividing PAT by the number of outstanding shares. A higher EPS generally signals a more profitable company from an investor's standpoint, and that's usually a good thing, you know?
- Return on Equity (ROE): This ratio measures how much profit a company generates for each dollar of shareholder equity. It's calculated as PAT divided by Shareholder Equity. A solid ROE suggests the company is effectively using its shareholders' investments to create profits. I really like seeing a consistently high ROE.
- Price-to-Earnings (P/E) Ratio: While not directly derived from PAT alone, the P/E ratio, which compares a company's share price to its EPS, is fundamental for valuation. It gives us a sense of how much investors are willing to pay for each dollar of earnings.
Stakeholder Perspectives on PAT
Different groups care about PAT for different reasons:
- For Investors: As an investor, I use PAT to gauge a company's ability to generate returns for me. A strong and growing PAT can indicate a healthy, attractive investment. It directly influences dividends and the potential for capital appreciation.
- For Management: Company management uses PAT to assess their own operational efficiency and strategic decisions. It's a key performance indicator (KPI) that helps them understand if their strategies are actually leading to improved profitability after all costs are accounted for.
- For Creditors: Lenders look at PAT, though perhaps less directly than investors, to understand a company's financial health and its capacity to repay debts. A consistently positive PAT suggests stability.
PAT vs. Other Profit Measures: What's the Difference?
You'll often hear about various profit figures. It's easy to get them mixed up, but each serves a unique purpose.
PAT vs. PBT (Profit Before Tax)
The distinction here is pretty straightforward. PBT is the profit a company makes before it pays income tax. PAT is what's left after those taxes have been paid. PBT gives you a clearer picture of operational and financial efficiency before the taxman takes his share. PAT, however, shows you the real, spendable profit. For me, both are important, but PAT is the ultimate bottom line because taxes are an unavoidable expense.
PAT vs. EBITDA (Earnings Before Interest, Taxes, Depreciation, and Amortization)
EBITDA is another common metric, but it sits much higher up on the income statement than PAT. EBITDA essentially measures a company's operating performance before factoring in non-operating expenses like interest, taxes, and non-cash expenses like depreciation and amortization. It's useful for comparing companies across different industries or capital structures, as it strips out some of those varying elements. However, I wouldn't rely on EBITDA alone; it doesn't show the true cash generation or the final profit available to shareholders because it ignores interest, taxes, and the wear and tear on assets. PAT gives you that complete picture.
Limitations and Considerations When Using PAT
While PAT is incredibly useful, it's not a silver bullet. There are definitely a few things we need to keep in mind when interpreting it.
- Accounting Policies: Different companies might use varying accounting policies (e.g., depreciation methods, inventory valuation), which can affect their reported PAT. This is why I always stress looking at consistent policies when comparing companies.
- Non-Recurring Items: Sometimes, a company's PAT might be artificially inflated or deflated by one-off gains or losses from things like asset sales or legal settlements. You've gotta dig into the footnotes of the financial statements to identify these.
- Industry Differences: Comparing the PAT of a tech startup to a heavy manufacturing company directly might not make sense. Different industries have different cost structures, capital requirements, and tax implications, so context is key.
- Tax Rate Fluctuations: Changes in corporate tax rates can significantly impact PAT, even if operational performance remains the same. I always check for these external factors.
Ultimately, while PAT is a critical metric, it should always be analyzed in conjunction with other financial statements, ratios, and qualitative factors about the business. Don't just look at one number and make a decision!
Real-World Application: How I'd Use PAT
Let's say I'm looking at two hypothetical companies, 'InnovateTech Inc.' and 'SteadyGrowth Ltd.'. InnovateTech had a PBT of $100 million and paid $30 million in taxes, giving it a PAT of $70 million. SteadyGrowth had a PBT of $90 million and paid $20 million in taxes, resulting in a PAT of $70 million. On the surface, their PATs are identical. However, if I stop there, I miss a crucial detail. InnovateTech started with a higher pre-tax profit, suggesting better operational efficiency, but a higher tax burden brought its PAT down to SteadyGrowth's level. I'd then ask, 'Why was InnovateTech's tax rate higher?' Was it temporary? Is it sustainable? This quick example shows you why context and looking at the steps to PAT are so important.
So, the next time you see PAT on an income statement, you'll know it's not just another acronym. It’s the ultimate measure of a company’s financial success, showing you the real money it earned for its owners after settling all its dues, including those pesky taxes. It's a figure I always scrutinize carefully because, at the end of the day, it's what truly determines the value and potential of a business. Understanding PAT helps you speak the language of finance a whole lot better, and that's a skill I wouldn't trade for anything.